These scripts were created to record screencasts for a class on Data Engineering, so they’ll need to cover both high-level conceptual material as well as detailed examples or tutorials.
To do that we really wanted to have the flexibility of showing both slides as well as terminal or web interactions at the same time. We also figured it’s a good idea to have the ability to overlay a talking head when there’s not much other detailed interaction going on, so we also wanted to be sure we captured camera footage during the recordings as well.
This setup is designed to capture raw footage of all of those channels at once.
We looked around, but couldn’t find any off-the-shelf tools that really met our
needs for this. It turns out this is actually pretty easy to accomplish just
using ffmpeg
directly from a script.
Note the desktop setup:
Ubuntu desktop with three monitors set up within a single X session. You’ll want at least two to capture both slides and terminal/web at once
Each desktop is 1920x1080
, so the total big desktop size is 3x1920
pixels
wide and 1080 pixels tall
Terminals/Browsers run on the left-hand monitor
Slides are full-screen on the center monitor
Webcam lives on top of the left monitor so we’re looking roughly towards the camera when going through a detailed example
Sound is coming from a lavalier mic plugged into a USB audio interface made available via standard Linux alsa devices
I use the right-hand monitor to hold terminal windows to start/stop these scripts, but nothing from there is recorded
Below, we’ll go through each of the different capture channels used
and then wrap it all up with a bow into a single script that follows
the screencasts -> shots -> takes
file organization that we used to keep
track of all of this.
To capture a stream of slides, we’re using the x11grab
ffmpeg interface. This
is designed to just sample what the X server sees every so often ($framerate
)
and then encode and save that as a video stream.
The tricky part is creating a command to record the correct monitor for slides.
Since the middle monitor is running slides, we tell ffmpeg
to capture a
single monitor’s 1920x1080
worth of screen but start that from the geometry
offset +1920,0
… the top of the middle monitor.
The command
1 2 3 4 5 6 |
|
gets wrapped in a bash function to capture slides:
1 2 3 4 5 6 7 8 9 10 |
|
This saves to the files slides.mkv
and slides.log
.
We’ll use x11grab
to record the left-hand monitor as well. The offset here is
just the top of the left-hand monitor, so +0,0
in X geometry speak:
1 2 3 4 5 6 7 8 9 10 |
|
This saves to the files terminal.mkv
and terminal.log
.
To capture the stream from the webcam, we’re relying heavily on the fact that
the
Logitech HD Pro Webcam C920
does hardware h264 encoding on the fly and we’re just tapping into that using
ffmpeg’s v4l2
interface to simply copy
the video stream out to a file.
I also had some problems understanding the timestamps that the camera’s
hardware encoder used, so I include the set of ffmpeg
args that fixed that.
YMMV depending on your camera.
Probably the most important thing to recognize is that the capture relied on the hardware encoding. If we were getting raw video and having to encode on the fly, then the desktop’s computational capabilities my come more into play. This usually results is limiting the framerate you can actually record.
Here’s the function to capture the camera footage:
1 2 3 4 5 6 7 8 9 |
|
This saves to webcam.mkv
and webcam.log
.
Audio is coming in through a
TASCAM US-2x2
USB-audio interface, where I have a
lavalier mic
plugged in. This “just worked” through the alsa
interface for ffmpeg
so we
just need to copy the raw audio stream from the device:
1 2 3 4 5 6 7 8 9 |
|
which saves audio.wav
and audio.log
.
So all of the above functions get rolled up into a single script named
capture
.
This script kicks off the ffmpeg
recordings at roughly the same
time and saves all the output to
1
|
|
where the variables in there either are defaults (like the shot number) or are specified as arguments to the script. I typically use it like
1 2 |
|
which kicks off the recording and streams outputs to files such as
1 2 3 4 5 6 7 8 9 10 |
|
This folder structure lets us keep things nice and tidy for editing.
So here’s the final script:
1 2 3 4 5 6 7 8 9 10 11 12 13 14 15 16 17 18 19 20 21 22 23 24 25 26 27 28 29 30 31 32 33 34 35 36 37 38 39 40 41 42 43 44 45 46 47 48 49 50 51 52 53 54 55 56 57 58 59 60 61 62 63 64 65 66 67 68 69 70 71 72 73 74 75 76 77 78 79 80 81 82 83 |
|
Note that each function is run in the background so they’re effectively kicked off in parallel.
]]>Of course, developers can easily create their own individual or G-Suite GCP accounts. They can take advantage of the free trial that Google Cloud offers. That’s great, and everything’s hunky-dory until the credit runs out. What then?
In this post I describe a really simple way to set up and use centralized billing on GCP… even across external development accounts. Way better than trying to get me to fill out expense reports for infradev!
Let’s consider a common example with two separate organizations in the mix.
A bigcorp.com
organization that’s footing the bill for everything
An individual developer’s G-Suite organization, pinkponies.io
, where
we’ll be doing the development
In this example, we’re assuming the developer organization pinkponies.io
is a
full G-Suite account and not just an ordinary GCP account created using a
single email.
It’s easy for an individual developer to create a new G-Suite account and that
turns out to be the more typical situation for this kind of cross billing
example. I also really recommend using developer G-Suite accounts for cloud
development in general since they’ll have the same IAM capabilities and
concerns as the bigcorp.com
account.
Each developer will need accounts in both orgs to start with.
Take Sam for example. Sam’s already an Owner of pinkponies.io
… with
sam@pinkponies.io
as a login.
Sam works for BigCorp and is also sam@bigcorp.com
where they live in some
folder within the bigcorp.com
organization’s GCP IAM.
bigcorp.com
So the billing_account_user
(sam@bigcorp.com
) needs to be able to create
billing accounts within the BigCorp org.
Sam will need to be assigned a BillingAccountCreator
role within the
bigcorp.com
org’s IAM on GCP.
pinkponies.io
It’s no surprise, the gsuite_user
(sam@pinkponies.io
) needs to be an
OrganizationAdministrator
on that org.
The billing_account_user
(sam@bigcorp.com
) needs permissions on the
pinkponies.io
org too. They need to be:
BillingAccountAdministrator
for the pinkponies.io
orgProjectCreator
on the pinkponies.io
orgOrganizationAdministrator
on pinkponies.org
for
good measureI like to manage infrastructure using Terraform and keep all my templates and modules checked into GitHub.
The Terraform templates to create these projects are super simple. There’s a provider, a resource for the managed project we want to create, and then a couple of role binding resources
1 2 3 4 5 6 7 8 9 10 11 12 13 14 15 16 17 18 19 20 21 |
|
There’s no need to get Terraform to slurp in data sources for the GCP orgs, folders, billing accounts, etc. In this example, we’ll just create variables for them
1 2 3 4 5 6 7 8 9 10 |
|
and look up the values from the cloud consoles for both our bigcorp.com
and
pinkponies.io
accounts. We’ll add these to terraform.tfvars
1 2 3 4 5 6 |
|
Note that there’s a terraform.tfvars.template
included in the example repo
but the actual *.tfvars
files, with sensitive account details, are ignored by
revision control so you’ll have to copy the template and create your own
terraform.tfvars
.
You can clone and configure the example templates
terraform.tfvars
and edit it with your infogcloud
Terraform’s provider for GCP needs GCP credentials for your account. The easiest thing to do to get that working before trying to run Terraform is to make sure gcloud is working correctly.
You can do that by installing gcloud and running gcloud init
to go through
the oauth dance… that works. You’d need to export your
GOOGLE_APPLICATION_CREDENTIALS
as well… usual stuff.
However, as an easier alternative, use the cloud shell in the cloud console for
your bigcorp.com
equivalent account. The gcloud config and applcation
credentials are all already set up for you.
Side note: The cloud shell is really useful… check it out if you haven’t!
Make sure you’re driving terraform using credentials (your gcloud
config)
from the equivalent of your bigcorp.com
account and not your
pinkponies.io
G-Suite org account.
Download Terraform from https://terraform.io/. Terraform is a standalone binary so it’s simple to install… even in your GCP Cloud Shell.
Init terraform’s providers and state management
terraform init
Then check out what changes we’re _plan_ning to make
terraform plan
If all looks good from there, then apply that plan to actually create our project
terraform apply
Check out the project we just created
gcloud beta billing projects list --billing-account=<billing_account_id>
Check out the same project from the Cloud Console for your pinkponies.io
G-Suite account.
Now you can use that account within your pinkponies.io
G-Suite account and
any charges go straight to your BigCorp billing account.
When you’re all done, you can clean up after yourself by removing the project and role bindings we created
terraform destroy
then deleting the billing account through the Cloud Console. You could (and should) totally manage the billing accounts themselves in the bigcorp.org using Terraform templates as well, but that’s another story.
No big corps or pink ponies were harmed in the production of this post.
]]>SVDS is a boutique data science consulting firm. We help folks with their hardest Data Strategy, Data Science, and/or Data Engineering problems. In this role, we’re in a unique position to solve different kinds of problems across various industries… and start to recognize the patterns of solution that emerge. That’s what I’d like to share.
This talk is about some common data pipeline patterns used across various kinds of systems across various industries. Key Takeaways include:
Along the way, I point out commonalities across business verticals and we see how volume and latency requirements, unsurprisingly, turn out to be the biggest differentiators in solution.
The primary goal of an ingestion pipeline is to… ingest events. All other considerations are secondary. We walk through an example pipeline and discuss how that architecture changes as we adjust scaling up to handle billions of events a day. We’ll note along the way how general concepts of immutability and lazy evaluation can have large ramifications on data ingestion pipeline architecture.
I start out covering typical classes of and types of events, some common event fields, and various ways that events are represented. These vary greatly across current and legacy systems, and you should always expect that munging will be involved as you’re working to ingest events from various data sources over time.
For our sessionization examples, we’re interested in user events such as
login
, checkout
, add friend
, etc.
These user events can be “flat”
1 2 3 4 5 6 7 8 9 10 |
|
or have some structure
1 2 3 4 5 6 7 8 9 10 11 12 13 14 15 16 17 |
|
and often both formats get used in the same systems in the wild so you have to intelligently detect or classify events rather than just making blatant assumptions about them. And yes, that is expensive… but it’s surprisingly common.
So what do basic ingestion pipelines usually look like?
Tenants to keep in mind here… build a pipeline that’s immutable, lazy, simple/composable, and testable. I come back to these often throughout the talk.
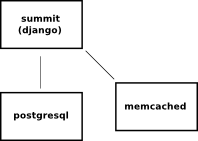
With our stated goal of ingesting events, it should look pretty simple right? Something along the lines of
I introduce the “Power of the Query Side”… query-side tools are fast nowadays. Tools such as Impala have really won me over. The Ingest pipeline needs to get the events as raw as possible as far back as possible in a format that’s amenable to fast queries. Let’s state that again… it’s important. The pipeline’s core job is to get events that are as raw as possible (immutable processing pipeline) as far back into the system as possible (lazily evaluated analysis) before any expensive computation is done. Modern query-side tools support these paradigms quite well. Better performance is obtained when events land in query-optimized formats and are grouped into query-optimized files and partitions where possible
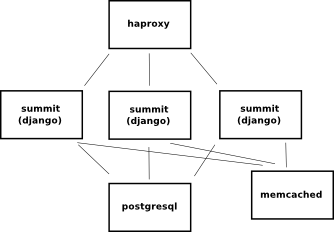
That’s simple enough and seems pretty straightforward in theory. In practice you can ingest events straight into files in hdfs only up to a certain scale and degree of event complexity.
As scale increases, an ingestion pipeline has to become effectively a dynamic impedance matching network. It’s the funnel that’s catching events from what can be a highly distributed, large number of data sources and trying to slam all these events into a relatively small number of filesystem datanodes.
What can we we do to match those separate source sizes from target sizes? use Spark! :-)
No, but seriously, add a streaming solution in-between (I do like Spark Streaming here) and use Kafka to decouple all the bits in such a way that your datasources on the left, and your datanodes on the right can scale independently! And independently from any stream computation infrastructure you might need for in-stream decisions in the future. I go through that in a little more detail in the talk itself.
Impedance or size mismatches between data sources and data storage are really only one half of the story. Note that another culprit, event complexity, can limit ingest throughput for a number of reasons. A common example of where this happens is when event “types” are either poorly defined or are changing so much they’re hard to identify. As event complexity increases, so does the logic you use to group or partition the events so they’re fast to query. In practice this quickly grows from simple logic to full-blown event classification algorithms. Often those classification algorithms have to learn from the body of events that’ve already landed. You’re making decisions on events in front of you based on all the events you’ve ever seen. I’ll bump any further discussion of that until we talk more about state in the “Recognize Activity” section later.
Ingest pipelines can get complicated as you try to scale in size and complexity… expect it!… plan for it! The best way is to do this is to build or use a toolchain that can let you add a streaming and queueing solution without a lot of rearchitecture or downtime. Folks often don’t try to solve this problem until it’s already painful in production! There’re great ways to solve this in general. My current fav atm uses a hybrid combination of Terraform, Consul, Ansible, and ClouderaManager/Ambari.
Note also that we haven’t talked about any real-time processing or low-latency business requirements here at all. The need for a stream processing solution arises when we’re just trying to catch events at scale.
Catching events within the system is an interesting challenge all by itself. However, just efficiently and faithfully capturing events isn’t the end of the story.
That’s sorta boring if we’re not taking action on events as we catch them.
Actions such as
can be taken in either “batch” or “real-time” modes.
Unfortunately, folks have all sorts of meanings for these terms. Let’s clear that up and be a little more precise…
For every action you intend to take, and really every data product of your pipeline, you need to determine the latency requirements. What is the timeliness of that resulting action? So how soon after either a.) an event was generated, or b.) an event was seen within the system will that resulting action be valid? The answers might surprise you.
Latency requirements let you make a first-pass attempt at specifying the execution context of each action. There are two separate execution contexts we talk about here… batch and stream.
batch. Asynchronous jobs that are potentially run against the entire body of events and event histories. These can be highly complex, computationally expensive tasks that might involve a large amount of data from various sources. The implementations of these jobs can involve Spark or Hadoop map-reduce code, Cascading-style frameworks, or even sql-based analysis via Impala, Hive, or SparkSQL.
stream. Jobs that are run against either an individual event or a small window of events. These are typically simple, low-computation jobs that don’t require context or information from other events. These are typically implemented using Spark-streaming or Storm code.
When I say “real-time” in this talk, I mean that the action will be taken from within the stream execution context.
It’s important to realize that not all actions require “real-time” latency. There are plenty of actions that are perfectly valid even if they’re operating on “stale” day-old, hour-old, 15min-old data. Of course, this sensitivity to latency varies greatly by action, domain, and industry. Also, how stale stream -vs- batch events are depend of the actual performance characteristics of your ingestion pipeline under load. Measure all the things!
An approach I particularly like is to initially act from a batch context. There’s generally less development effort, more computational resources, more robustness, more flexibility, and more forgiveness involved when you’re working in a batch execution context. You’re less likely to interrupt or congest your ingestion pipeline.
Once you have basic actions working from the batch layer, then do some profiling and identify which of the actions you’re working with really require less stale data. Selectively bring those actions or analyses forward. Tools such as Spark can help tremendously with this. It’s not all fully baked yet, but there are ways to write spark code where the same business logic code can be optionally bound in either stream or batch execution contexts. You can move code around based on pipeline requirements and performance!
In practice, a good deal of architecting such a pipeline is all about preserving or protecting your stream ingestion and decision-making capabilities for when you really need them.
A real system often involves additionally protecting and decoupling your stream processing from making any service API calls (sending emails for example) by adding kafka queues for things like outbound notifications downstream of ingestion as well as isolating your streaming system from writes to hdfs using the same trick (as we saw above)
What’s user activity? Usually it’s a Sequence of one or more events associated with a user. From an infrastructure standpoint, the key distinction is that activity is constructed from a sequence of user events… that don’t all fit within a single window of stream processing. This can either be because there are too many of them or because they’re spread out over too long a period of time.
Another way to think of this is that event context matters. In order to recognize activity as such, you often need to capture or create user context (let’s call it “state”) in such a way that it’s easily read by (and possibly updated from) processing in-stream.
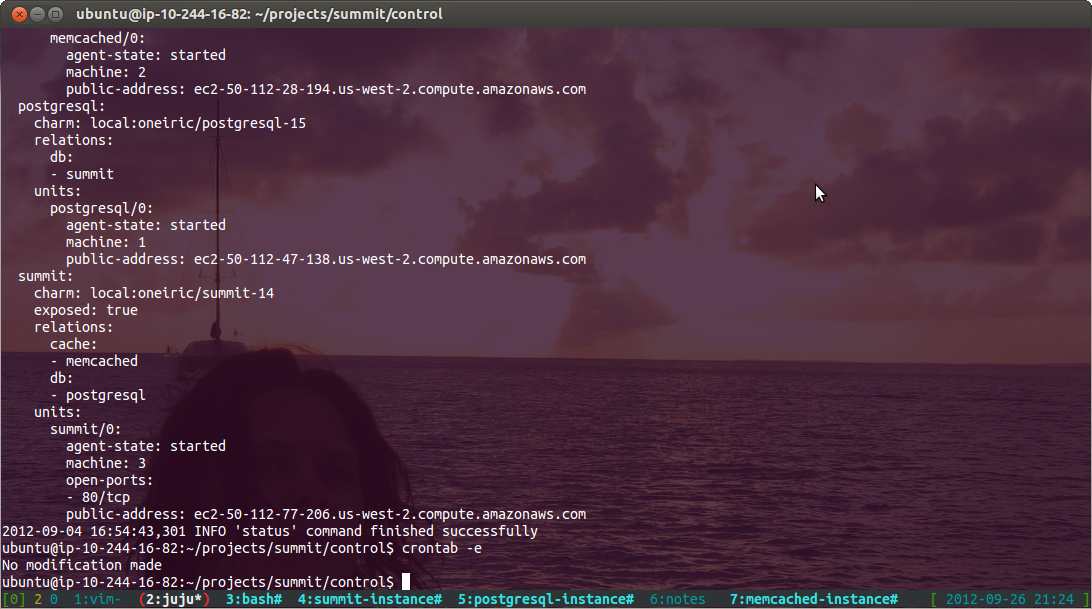
We add hbase to our standard stack, and use it to store state
which is then accessible from either stream or batch processing. HBase is attractive as a fast key-value store. Several other key-value stores could work here… I’ll often start using one simply because it’s easier to deploy/manage at first. Then refine the choice of tool once more precise performance requirements of the state store have emerged from use.
It’s important to note that you want fast key-based reads and writes. Full-table scans of columns are pretty much verboten in this setup. They’re simply too slow for value from stream.
The usual approach is to update state in batch. My favorite example when first talking to folks about this approach is to consider a user’s credit score. Events coming into the system are routed in stream based on the associated user’s credit score.
The stream system can simply (hopefully quickly) look that up in HBase keyed on a user id of some sort The credit score is some number calculated by scanning across all a user’s events over the years. It’s a big, long-running, expensive computation. Do that continuously in batch… just update HBase as you go. If you do that, then you make that information available for decisions in stream.
Note that this is effectively a way to base fast-path decisions on information learned from slow-path computation. A way for the system to quite literally learn from the past :-)
Another example of this is tracking a package. The events involved are the various independent scans the package undergoes throughout its journey.
For “state” you might just want to keep an abbreviated version of the raw history of each package or just some derived notion of its state those derived notions of state are tough to define from a single scan in a warehouse somewhere… but make perfect sense when viewed in the context of the entire package history.
I eventually come back to our agenda:
Along the way we’ve done a nod to some data-plumbing best practices… such as
Query-side tools are fast – use them effectively!
A datascience pipeline is
When building datascience pipelines, these paradigms help you stay flexible and scalable
DevOps is your friend. We’re using an interesting pushbutton stack that’ll be the topic of another blog post :-)
TDD/BDD is your friend. Again, I’ll add another post on “Sanity-Driven Data Science” which is my take on TDD/BDD as applied to datascience pipelines.
Fail fast, early, often… along with the obligatory reference to the Netflix Simian Army.
It was a somewhat challenging presentation format. I presented a live video feed solo while the audience was watching live and had the ability to send questions in via chat… no audio from the audience. Somewhat reminiscent of IRC-based presentations we used to do in Ubuntu community events… but with video.
The moderator asked the audience to queue questions up until the end, but as anyone who’s been in a classroom with me knows, I welcome / live for interruptions :-) In this case, I could easily see the chat window as I presented so asking-questions-along-the-way is supported on that presentation platform. I’d definitely ask for that in the future.
I do prefer the fireside chat nature of adding one or two more folks into the feed… kinda like on-the-air hangouts… where the speaker can get audible feedback from some folks. Overall though this was a great experience and folks asked interesting questions at the end. I’m not sure how it’ll be published, but questions had to be done in a second section as I dropped connectivity right at the end of the speaking session.
Slides are available here, and you can get the video straight from the hadoop with the best site. Note that the slides are reveal.js and I make heavy use of two-dimensional navigation. Slides advance downwards, topics advance to the right.
Update: this post has be perdied-up (thanks Meg!) and reposted as part of our svds blog.
]]>Rather than get bitten by the ideosyncracies involved in running spark on yarn -vs- standalone when you go to deploy, here’s a way to set up a development environment for spark that more closely mimics how it’s used in the wild.
Run a docker image for a cdh standalone instance
docker run -d --name=mycdh svds/cdh
when the logs
docker logs -f mycdh
stop going wild, you can run the usual hadoop-isms to set up a workspace
docker exec -it mycdh hadoop fs -ls /
docker exec -it mycdh hadoop fs -mkdir -p /tmp/blah
Then, it’s pretty straightforward to run spark against yarn
docker exec -it mycdh \
spark-submit \
--master yarn-cluster \
--class org.apache.spark.examples.SparkPi \
/usr/lib/spark/examples/lib/spark-examples-1.3.0-cdh5.4.3-hadoop2.6.0-cdh5.4.3.jar \
1000
Note that you can submit a spark job to run in either “yarn-client” or “yarn-cluster” modes.
In “yarn-client” mode, the spark driver runs outside of yarn and logs to console and all spark executors run as yarn containers.
In “yarn-cluster” mode, all spark executors run as yarn containers, but then the spark driver also runs as a yarn container. Yarn manages all the logs.
You can also run the spark shell so that any workers spawned run in yarn
docker exec -it mycdh spark-shell --master yarn-client
or
docker exec -it mycdh pyspark --master yarn-client
Ok, so SparkPi
is all fine and dandy, but how do I run a real application?
Let’s make up an example. Say you build your spark project on your laptop in the
/Users/myname/mysparkproject/
directory.
When you build with maven or sbt, it typically builds and leaves jars under a
/Users/myname/mysparkproject/target/
directory… for sbt, it’ll look like
/Users/myname/mysparkproject/target/scala-2.10/
.
The idea here is to make these jars directly accessible from both your laptop’s build process as well as from inside the cdh container.
When you start up the cdh
container, map this local host directory up and
into the container
docker run -d -v ~/mysparkproject/target:/target --name=mycdh svds/cdh
where the -v
option will make ~/mysparkproject/target
available as /target
within the container.
So,
sbt clean assembly
leaves a jar under ~/mysparkproject/target
, which the container sees as
/target
and you can run jobs using something like
docker exec -it mycdh \
spark-submit \
--master yarn-cluster \
--name MyFancySparkJob-name \
--class org.markmims.MyFancySparkJob \
/target/scala-2.10/My-assembly-1.0.1.20151013T155727Z.c3c961a51c.jar \
myarg
The --name
arg makes it easier to find in the midst of multiple yarn jobs.
While a spark job is running, you can get its yarn “applicationId” from
docker exec -it mycdh yarn application -list
or if it finished already just list things out with more conditions
docker exec -it mycdh yarn application -list -appStates FINISHED
You can dig through the yarn-consolidated logs after the job is done by using
docker exec -it mycdh yarn logs -applicationId <applicationId>
Web consoles are critical for application development. Spend time up front getting ports open or forwarded correctly for all environments. Don’t wait until you’re actually trying to debug something critical to figure out how to forward ports to see the staging UI in all environments.
Yarn gives you quite a bit of info about the system right from the ResourceManager on its ip address and webgui port (usually 8088)
open http://<resource-manager-ip>:<resource-manager-port>/
Yarn also conveniently proxies access to the spark staging UI for a given application. This looks like
open http://<resource-manager-ip>:<resource-manager-port>/proxy/<applicationId>
for example,
open http://localhost:8088/proxy/application_1444330488724_0005/
There are a few ways to deal with accessing port 8088
of the yarn resource
manager from outside of the docker container. I typically use ssh for
everything and just forward ports out to localhost
on the host. However,
most people will expect to access ports directly on the docker-machine ip
address. To do that, you have to map each port when you first spin up the
cdh
container using the -p 8088
option
docker run -d -v target -p 8088 --name=mycdh svds/cdh
Then you should be good to go with something like
open http://`docker-machine ip`:8088/
to access the yarn console.
The docker image svds/cdh
is quite large (2GB). I like to do a separate
docker pull
from any docker run
commands just to isolate the download.
In fact, I recommend pinning the cdh version for the same reason… so
docker pull svds/cdh:5.4.0
for instance, then refer to it that way
throughout docker run -d --name=mycdh svds/cdh:5.4.0
and that’ll insure
you’re not littering your laptop’s filesystem with docker layers from
multiple cdh versions. The bare svds/cdh
(equiv to svds/cdh:latest
)
floats with the most recent cloudera versions
I’m using a CDH container here… but there’s an HDP one on the way as well. Keep an eye out for it on svds’s dockerhub page
web consoles and forwarding ports through SSH
Ok, so the downside here is that the image is fat. The upside is that it lets you play with the full suite of CDH-based tools. I’ve tested out (besides the spark variations above)
docker exec mycdh impala-shell
docker exec mycdh hbase shell
echo "show tables;" | docker exec mycdh beeline -u jdbc:hive2://localhost:10000 -n username -p password -d org.apache.hive.jdbc.HiveDriver
]]>Agenda:
It’s common practice to secure a cluster of servers using a bastion
host.
This might be a cluster of servers in a colocation facility, containers on a
single host, or instances in an EC2
region… the pattern can still be applied.
The way this works is that the servers in the cluster are all locked down and not accessible to the outside world except where necessary for the production network design of the pipeline or application.
That’s all great for production network traffic. However, there’s often a need
for adhoc access: testing, debugging, monitoring, etc of the cluster. This is
usually access to information that’s required in addition to the existing
monitoring and logging for the production pipeline. Until automated management
solutions involving immutable infrastructure components are widely adopted,
you’ll almost always need the ability for an engineer to directly log into
cluster instances to do things like clear /tmp
directories, run jobs, etc.
You’ve also gotta routinely access various web consoles (ClouderaManager, spark, hdfs, etc) to debug functional or performance problems, to change config, or even just to do sanity checks on overall cluster health.
How do you access all of this? You can’t just expose them to the outside world. None of these consoles were ever designed for that. They’re rife with holes… with often huge ramifications for any incursions! On the other hand, it’s often quite difficult (and dangerous!) to add adhoc network access into production network planning.
Two practices are common:
They each have pros/cons, tradeoffs between security, ease-of-use, flexibility, and capability. VPN access is often ineffective due to its static nature and sensitivity to all manner of bad security practices. It’s particularly pointless due to the random way different web consoles choose which interfaces they like to bind to. That’s a whole other discussion… for this talk, suffice it to say that I highly recommend and infinitely prefer an SSH-based solution. It’s worth traversing the learning curve of SSH for the sheer power and flexiblity it gives you without compromising security.
In your home directory, there’s an optional ~/.ssh/config
file
where you can customize your local SSH client behavior.
You can use this for simple aliases…
#################
# MyBastions
#################
Host customerXbastion
Hostname ec2-xxx-xxx-xxx-xxx.compute-1.amazonaws.com
Host customerYbastion
Hostname ec2-yyy-yyy-yyy-yyy.compute-1.amazonaws.com
Host customerZbastion
Hostname ec2-zzz-zzz-zzz-zzz.compute-1.amazonaws.com
or adding extra stuff that’s a pain to type every time
############
# CustomerX
############
Host dev-control-*.customerX.com
User ubuntu
IdentityFile ~/projects/customerX/creds/dev_control.pem
Host dev-es-*.customerX.com
User ubuntu
IdentityFile ~/projects/customerX/creds/dev_es.pem
Host dev-hdp-*.customerX.com
User ubuntu
IdentityFile ~/projects/customerX/creds/dev_hdp.pem
(etc)
notice the pattern entries?
You can include tunnels (discussed below)
Host myserver
Hostname 10.2.3.4
LocalForward 7080 localhost:7080
LocalForward 8080 localhost:8080
or proxies (also discussed below)
#############
# CustomerY
#############
Host customerYbastion
Hostname ec2-yyy-yyy-yyy-yyy.compute-1.amazonaws.com
User ubuntu
ProxyCommand none
Host *.inside.customerY.com
User ubuntu
ProxyCommand ssh customerYbastion nc -q0 %h %p
Once you add multiple cluster configs and different customer environments, these SSH config files can get quite complex. Here’re a couple of ways I’ve seen people manage that:
just manage one big ~/.ssh/config
file by hand and use Host
names and
comments to keep track of everything
explictly specify config files at the command line a la ssh -F
~/.ssh/customerX-config <server>
… maybe even use a shell alias to shorten
this if you do it a lot
[what I currently do] scripts to glue multiple config snippets from
~/.ssh/config.d/customerX.conf
into a single big read-only ~/.ssh/config
.
It’d be nice to eventually change the ssh client to optionally read from
these kind of ~/.ssh/config.d/
and ~/.ssh/authorized_keys.d/
snippet
directories
customer-specific containers… I actually work a lot from inside of containers on an ec2 instance. I usually have them just bind-mount the underlying hosts home directory, but you could easily keep them isolated with separate config and spin them up only when you need overlay specific to a customer. This also works even with gui apps on a laptop btw, but that’s a longer story :)
It’s also pretty common for folks to write scripts using config management
(juju, knife, or ClouderaManager-like APIs) to generate ssh config snippets
from a running infrastructure. This can be quite useful, but is still a static
picture of a cluster that changes. Depending on the lifetime or stability of
the cluster, you’re often better off using a more dynamic approach like knife
ssh
. It’s a no-win tradeoff of sharing static SSH config snippets -vs-
configuring chef environments for everyone who needs to access the cluster.
I’d love to hear other solutions folks have come up with to deal with this. I have no clue what puppet offers here, and I bet there are great examples of ansible’s ec2 plugin that’ll be a dead-simple way to interact with a dynamic host inventory. Perhaps that’s where I’ll head next… we’ll see. Totally depends on customer environments.
One server, a bastion
host, accepts SSH traffic from the outside world.
Remaining target
hosts in the cluster are configured internal access only.
Consider the following scenario using a ProxyCommand
.
Take an externally accessible bastion
and an internally accessible target
.
Set up your SSH config so you can ssh directly to the bastion
host
+--------------------+ +-------------------+
| | | |
| | | |
| | | |
| | | |
| | | |
| laptop | | bastion |
| | ssh | |
| +---------> +
| | | |
| | | |
| | | |
| | | |
| | | |
| | | |
| | | |
+--------------------+ +-------------------+
with a command like
`ssh bastion`
Then you can ssh from there to a target
host
+-------------------+ +-------------------+
| | | |
| | | |
| | | |
| | | |
| | | |
| bastion | | target |
| | ssh | |
| +----------> |
| | | |
| | | |
| | | |
| | | |
| | | |
| | | |
| | | |
+-------------------+ +-------------------+
`ssh target`
The key bit here is that we can compress this to one step for the user.
+--------------------+ +-------------------+ +-------------------+
| | | | | |
| | | | | |
| | | | | |
| | | | | |
| | | | | |
| laptop | | bastion | | target |
| | ssh | | ssh | |
| +---------> +-------> |
| | | | | |
| | | | | |
| | | | | |
| | | | | |
| | | | | |
| | | | | |
| | | | | |
+--------------------+ +-------------------+ +-------------------+
From laptop’s ~/.ssh/config
file:
Host bastion
Hostname ec2-xxx.xxx.....amazon.com
Host target
Hostname ip-10-xx-xx-xx.internal....amazon.com
ProxyCommand ssh bastion nc -q1 %h %p
then you can just ssh target
directly from your laptop. It automatically
traverses the proxy bastion
on your behalf.
Note, that from an administrative perspective, it’s easy to control user access
at the single bastion
… if you can’t establish an ssh connection to the
bastion, you can’t “jump through it” to internal hosts.
SSH in general is a tunnel
+-----------------------+ +------------------------+
| | | |
| | | |
| | Inet | |
| | | |
| +-----------------------------> |
| + <-- text --> | fred |
| + | |
| laptop +-----------------------------> (ec2 instance) |
| | | |
| | | (any remote server) |
| | | |
| | | |
| | | |
| | | |
| | | |
| | | |
| | +------------------------+
+-----------------------+
`ssh fred`
aka, “port forwarding”
+----------------+ +------------------------+
| | | |
| | | |
| | | |
-- 8888 ->| | | |
| +------------------> |
| + <-- text --> | |
| + <-- web --> | | -----> http://nfl.com/
| laptop +------------------> ec2 instance |
| | | |
| | | (any remote server) |
| | | |
| | | |
| | | |
| | | |
| | | |
| | | |
| | +------------------------+
+----------------+
`ssh fred -L8888:www.nfl.com:80`
`open http://localhost:8888/`
+------------+ +------------------------+
| | | |
| | | |
-- 50070->| | | |
| | | | http://... <---+
| | | | (50070) |
| +----------------> | |
| + <-----> | | |
| + <-----> | | ----------------+
| laptop +----------------> ec2 instance |
| | | |
| | | (any remote server) |
| | | |
| | | |
| | | |
| | | |
| | | |
| | | |
| | +------------------------+
+------------+
`ssh fred -L8888:localhost:80`
or, perhaps more useful…
`ssh fred -L50070:localhost:50070`
`open http://localhost:50070/`
or
`ssh fred -L50070:localhost:50070 -L50030:localhost:50030`
+-----------------------+ +------------------------+
| | | |
| | -- 2222 ->| |
| | | |
| | | |
| | | |
| +-----------------------------> |
| + <-----> | |
| + <-----> | |
| laptop +-----------------------------> ec2 instance |
| | | |
| | | (any remote server) |
| | | |
| | 22 <---+ | |
| | | | |
| | | | |
| |--------+ | |
| | | |
| | +------------------------+
+-----------------------+
`ssh fred -R2222:localhost:22`
or maybe something like…
`ssh fred -R8888:localhost:80`
or even ssh root@fred -R80:localhost:80
Host myhost
Hostname 10.1.2.3
LocalForward 7080 localhost:7080
LocalForward 8080 localhost:8080
]]>As before, there are links to the whole series of charmschool hangouts in the juju video archive where we also have videos and screencasts of demos, talks, and any other charm schools we’ve been able to capture on video.
]]>These are really interesting in that they involve migrating environments between providers. This works slightly differently on the newer juju-1.x series, but the idea’s still sound.
There’s no sound on these… they’re raw video backups for demoing juju (in case we lost networking during the demo).
migrate local to hp
migrate ec2 to hpcloud
Local provider
]]>Starting from a simple node.js application, we put together “just enough” charm to get things working. Watch for future episodes where we’ll refactor and refine both the application and the charm.
As before, there are links to the whole series of charmschool hangouts in the juju video archive where we also have videos and screencasts of demos, talks, and any other charm schools we’ve been able to capture on video.
]]>There’re links to the whole series of charmschool hangouts in the juju video archive where we also have videos and screencasts of demos, talks, and any other charm schools we’ve been able to capture on video.
]]>Watch it here or
]]>Hey, so last month we ran scheduling for the Linux Plumbers Conference entirely on juju!
Here’s a little background on the experience.
Along the way, we’ll go into a little more detail about running juju in production than the particular problem at hand might warrant. It’s a basic stack of services that’s only alive for 6-months or so… but this discussion applies to bigger longer-running production infrastructures too, so it’s worth going over here.
So summit is this great django app built for scheduling conferences. It’s evolved over time to handle UDS-level traffic and is currently maintained by a Summit Hackers team that includes Chris Johnston and Michael Hall.
Chris contacted me to help him use juju to manage summit for this year’s Plumbers conference. At the time we started this, the 11.10 version of juju wasn’t exactly blessed for production environments, but we decided it’d be a great opportunity to work things out.
A typical summit stack’s got postgresql, the django app itself, and a memcached server.
We additionally talked about putting this all behind some sort of a head like haproxy.
This’d let the app scale horizontally as well as give us a stable point to attach an elastic-ip. We decided to not do this at the time b/c we could most likely handle the peak conference load with a single django service-unit provided we slam select snippets of the site into memcached.
This turned out to be true load-wise, but it really would’ve been a whole lot easier to have a nice constant haproxy node out there to tack the elastic-ip to. During development (charm, app, and theme) you want the freedom to destroy a service and respawn it without having to use external tools to go around and attach public IP addresses to the right places. That’s a pain. Also, if there’s a sensitive part of this infrastructure in production, it wouldn’t be postgresql, memcached, or haproxy… the app itself would be the most likely point of instability, so it was a mistake to attach the elastic-ip there.
We chose to use ec2 to host the summit stack… mostly a matter of convenience. The juju openstack-native provider wasn’t completed when we spun up the production environment for linuxplumbers and we didn’t have access to a stable private ubuntu cloud running the openstack-ec2-api at the time. All of this has subsequently landed, so we’d have more options today.
We forked Michael Nelson’s excellent django charm to create a summit-charm and freely specialized it for summit.
Note that we’re updating this charm for 12.04 here, but this will probably go away in the near future and we’ll just use a generic django charm. It turns out we didn’t do too much here that won’t apply to django apps in general, but more on that another time.
There was nothing special about our tuning of postgresql or memcached. We just used the services provided by the canned charms. These sort of peripheral services aren’t the kind of charms you’re likely to be making changes to or tweaking outside of their exposed config parameters. I know jack about memcached, so I’ll defer to the experts in this regard. Similarly for postgresql… and haproxy if we used it in this stack.
The summit charm is a little different. It’s something we were continuing to tweak during development. Perhaps with future more generic django charm versions, we won’t need to tweak the charm itself… just configure it.
We used a “local” repository for all charms because the charm store hadn’t landed when we were setting this up. Well, now that the charm store is live, you can just deploy the canned charms straight from the store
`juju deploy -e summit memcached`
and keep the ones you want to tweak in a local repository…
`juju deploy -e summit --repository ~/charms local:summit`
all within the same environment. It works out nicely.
We had multiple people to manage the production summit environment. What’s the best way to do that? It turns out juju supports this pretty well right out of the box. There’s an environment config for the set of ssh public keys to inject into everything in the environment as it starts up… you can read more about that on askubuntu.
Note that this is only useful to configure at the beginning of the stack. Once you’re up, adding keys is problematic. I don’t even recommend trying b/c of the risk of getting undetermined state for the environment. i.e., different nodes with different sets of keys depending on when you changed the keys relative to what actions you’ve performed on the environment. It’s a problem.
What I recommend now is actually to use another juju environment… (and no, we’re not paid to promote cloud providers by the instance :) I wish! ) a dedicated “control” environment. You bootstrap it, then set up a juju client that controls the main production environment. Then set up a shared tmux session that any of the admins for the production environment can use:
Adding/changing the set of admin keys is then done in a single place. This technique isn’t strictly necessary, but it was certainly worth it here with different admins having various different levels of familiarity with the tools. I started it as a teaching tool, left it up because it was an easy control dashboard, and now recommend it because it works so well.
Yeah, so during development you break things. There were a couple of times using 11.10 juju that changes to juju core prevented a client from talking to an existing stack. Aargh! This wasn’t going to fly for production use.
The juju team has subsequently done a bunch to prevent this from happening, but hey we needed production summit working and stable at the time. The answer… freeze the code.
Juju has an environment config option juju-origin
to specify where to
get the juju installed on all instances in the environment. I branched juju
core to lp:~mark-mims/juju/running-summit
and just worked straight from there
for the lifetime of the environment (still up atm). Easy enough.
Now the tricky part is to make sure that you’re always using the
lp:~mark-mims/juju/running-summit
version of the juju cli when talking to the
production summit environment.
I set up
#!/bin/bash
export JUJU_BRANCH=$HOME/src/juju/running-summit
export PATH=$JUJU_BRANCH/bin:$PATH
export PYTHONPATH=$JUJU_BRANCH
which my tmuxinator config sources into every pane in my summit
tmux session.
This was also done on the summit-control
instance so it’s easy to make sure
we’re all using the right version of the juju cli to talk to the production
environment.
The juju ssh
subcommand to the rescue. You can do all your standard ssh
tricks…
juju ssh postgresql/0 'su postgres pg_dump summit' > summit.dump
… on a cronjob. Juju just stays out of the way and just helps out a bit with the addressing. Real version pipes through bzip2 and adds timestamps of course.
Of course snapshots are easy enough too via euca2ools, but the pgsql dumps themselves turned out to be more useful and easy to get to in case of a failover.
The biggest debugging activity during development was cleaning up the app’s theming. The summit charm is configured to get the django app itself from one application branch and the theme from a separate theme branch.
So… ahem… “best practice” for theme development would’ve been to develop/tweak the theme locally, then push to the branch. A simple
juju set --config=summit.yaml summit/0
would update config for the live instances.
Well… some of the menus from the base template used absolute paths so it was simpler to cheat a bit early in the process to test it all in-place with actual dns names. Had we been doing this the “right” way from the beginning we would’ve had much more confidence in the stack when practicing recovery and failover later in the cycle… we would’ve been doing it all since day one.
Another thing we had to do was manually test memcached. To test out caching we’d ssh to the memcached instance, stop the service, run memcached verbosely in the foreground. Once we determined everything was working the way we expected, we’d kill it and restart the upstart job.
This is a bug in the memcached charm imo… the option to temporarily run verbosely for debugging should totally be a config option for that service. It’d then be a simple matter of
juju set memcached/0 debug=true
and then
juju ssh memcached/0
to watch some logs. Once we’re convinced it’s working the way it should
juju set memcached/0 debug=false
should make it performant again.
Next time around, we should take more advantage of juju set
config to
update/reconfigure the app as we made changes… and generally implement a
better set of development practices.
Sorely lacking. “What? curl doesn’t cut it?”… um… no.
Our notion of failover for this app was just a spare set of cloud credentials and a tested recovery plan.
The plan we practiced was…
postgresql/0
and drop the db (Note: the postgresql charm
should be extended to accept a config parameter of a storage url, S3 in this
case, to slurp the db backups from)restore from offsite backups… something along the lines of
cat summit-$timestamp.dump.bz2 | juju ssh -e failover postgresql/0 ‘bunzip2 -c | su - postgres pgsql summit’ |
In practice, that took about 10-15minutes to recover once we started acting. Given the additional delay between notification and action, that could spell an hour or two of outtage. That’s not so great.
Juju makes other failover scenarios cheaper and easier to implement than they used to be, so why not put those into place just to be safe? Perhaps the additional instance costs for hot-spares wouldn’t’ve been necessary for the entire 6-months of lead-time for scheduling and planning this conference, but they’d certainly be worth the spend during the few days of the event itself. Juju sort of makes it a no-brainer. We should do more posts on this one issue… the game has changed here.
What would we do differently next time? Well, there’s a list :).
Lately we’ve been fleshing out our testing frameworks for Juju and Juju Charms. There’s lots of great stuff going on here, so we figured it’s time to start posting about it.
First off, the coolest thing we did during last month’s Ubuntu Developer Summit (UDS) was get the go-ahead to spend more time/effort/money scale-testing Juju.
James, Kapil, Juan, Ben, and Mark sat down over the course of a couple of nights at UDS to take a crack at it. We chose Hadoop. We started with 40 nodes and iterated up 100, 500, 1000 and 2000. Here’re some notes on the process.
Hadoop was a pretty obvious choice here. It’s a great actively-maintained project with a large community of users. It scales in a somewhat known manner, and the hadoop charm makes it super-simple to manage. There are also several known benchmarks that are pretty straightforward to get going, and distribute load throughout the cluster.
There’s an entire science/art to tuning hadoop jobs to run optimally given the characteristics of a particular cluster. Our sole goal in tuning hadoop benchmarks was to engage the entire cluster and profile juju during various activities throughout an actual run. For our purposes, we’re in no hurry… a slower/longer run gives us a good profiling picture for managing the nodes themselves under load (with a sufficient mix of i/o -vs- cpu load).
Surprisingly enough, we don’t really have that many servers just lying around… so EC2 to the rescue.
Disclaimer… we’re testing our infrastructure tools here, not benchmarking hadoop in EC2. Some folks advocate running hadoop in a cloudy virtualized environment… while some folks are die-hard server huggers. That’s actually a really interesting discussion. It comes down to the actual jobs/problems you’re trying to solve and how those jobs fit in your data pipeline. Please note that we’re not trying to solve that problem here or even provide realistic benchmarking data to contribute to the discussion… we’re simply testing how our infrastructure tools perform at scale.
If you do run hadoop in EC2, Amazon’s Elastic Map Reduce service is likely to perform better at scale in EC2 than just running hadoop itself on general purpose instances. Amazon can do all sorts of stuff internally to show hadoop lots of love. We chose not to use EMR because we’re interested in testing how juju performs with generic Ubuntu Server images, not EMR… at least for now.
Note that stock EC2 accounts limit you to something like 20 instances. To grow beyond that, you have to ask AWS to bump up your limits.
We started scale testing from a fresh branch of juju trunk… what gets deployed to the PPA nightly… this freed us up to experiment with live changes to add instrumentation, profiling information, and randomly mess with code as necessary. This also locks in the branch of juju that the scale testing environment uses.
As usual, juju will keep track of the state of our infrastructure going forward and we can make changes as necessary via juju commands. To bootstrap and spin up the initial environment we’ll just use shell scripts wrapping juju commands.
These scripts are really just hadoop versions of some standard juju demo scripts such as those used for a simple rails stack or a more realistic HA wiki stack.
The hadoop scripts for EC2 will get a little more complex as we grow simply because we don’t want AWS to think we’re a DoS attack… we’ll pace ourselves during spinup.
From the hadoop charm’s readme, the basic steps to spinning up a simple combined hdfs and mapreduce cluster are:
juju bootstrap
juju deploy hadoop hadoop-master
juju deploy -n3 hadoop hadoop-slavecluster
juju add-relation hadoop-master:namenode hadoop-slavecluster:datanode
juju add-relation hadoop-master:jobtracker hadoop-slavecluster:tasktracker
which we expand on a bit to start with a base startup script that looks like:
#!/bin/bash
juju_root="/home/ubuntu/scale"
juju_env=${1:-"-escale"}
###
echo "deploying stack"
juju bootstrap $juju_env
deploy_cluster() {
local cluster_name=$1
juju deploy $juju_env --repository "$juju_root/charms" --constraints="instance-type=m1.large" --config "$juju_root/etc/hadoop-master.yaml" local:hadoop ${cluster_name}-master
juju deploy $juju_env --repository "$juju_root/charms" --constraints="instance-type=m1.medium" --config "$juju_root/etc/hadoop-slave.yaml" -n 37 local:hadoop ${cluster_name}-slave
juju add-relation $juju_env ${cluster_name}-master:namenode ${cluster_name}-slave:datanode
juju add-relation $juju_env ${cluster_name}-master:jobtracker ${cluster_name}-slave:tasktracker
juju expose $juju_env ${cluster_name}-master
}
deploy_cluster hadoop
echo "done"
and then manually adjust this for cluster size.
Note that we’re specifying constraints to tell juju to use different sized ec2 instances for different juju services. We’d like an m1.large for the hadoop master
juju deploy ... --constraints "instance-type=m1.large" ... hadoop-master
and m1.mediums for the slaves
juju deploy ... --constraints "instance-type=m1.medium" ... hadoop-slave
Note that we’ll also pass config files to specify different heap sizes for the different memory footprints
juju deploy ... --config "hadoop-master.yaml" ... hadoop-master
where hadoop-master.yaml
looks like
# m1.large
hadoop-master:
heap: 2048
dfs.block.size: 134217728
dfs.namenode.handler.count: 20
mapred.reduce.parallel.copies: 50
mapred.child.java.opts: -Xmx512m
mapred.job.tracker.handler.count: 60
# fs.inmemory.size.mb: 200
io.sort.factor: 100
io.sort.mb: 200
io.file.buffer.size: 131072
tasktracker.http.threads: 50
hadoop.dir.base: /mnt/hadoop
and
juju deploy ... --config "hadoop-slave.yaml" ... hadoop-slave
where hadoop-slave.yaml
looks like
# m1.medium
hadoop-slave:
heap: 1024
dfs.block.size: 134217728
dfs.namenode.handler.count: 20
mapred.reduce.parallel.copies: 50
mapred.child.java.opts: -Xmx512m
mapred.job.tracker.handler.count: 60
# fs.inmemory.size.mb: 200
io.sort.factor: 100
io.sort.mb: 200
io.file.buffer.size: 131072
tasktracker.http.threads: 50
hadoop.dir.base: /mnt/hadoop
Note also that we also have our juju environment configured to use
instance-store images… juju defaults to ebs-rooted images, but that’s
not a great idea with hdfs. You specify this by adding a default-image-id
into your ~/.juju/environments.yaml
file.
This gave each of our instances an extra ~400G local drive
on /mnt
… hence the hadoop.dir.base
of /mnt/hadoop
in the config above.
Both the 40-node and 100-node runs went as smooth as silk. The only thing to note was that it took a while to get AWS to increase our account limits to allow for 100+ nodes.
Once we had permission from Amazon to spin up 500 nodes on our account, we initially just naively spun up 500 instances… and quickly got throttled.
No particular surprise, we’re not specifying multiplicity in the ec2 api, nor are we using an auto scaling group… we must look like a DoS attack.
The order was eventually fulfilled, and juju waited around for it. Everything ran as expected, it just took about an hour and 15 minutes to spin up the stack. This gave us a nice little cluster with HDFS storage of almost 200TB
The hadoop terasort job was run from the following script
#!/bin/bash
SIZE=10000000000
NUM_MAPS=1500
NUM_REDUCES=1500
IN_DIR=in_dir
OUT_DIR=out_dir
hadoop jar /usr/lib/hadoop/hadoop-examples*.jar teragen -Dmapred.map.tasks=${NUM_MAPS} ${SIZE} ${IN_DIR}
sleep 10
hadoop jar /usr/lib/hadoop/hadoop-examples*.jar terasort -Dmapred.reduce.tasks=${NUM_REDUCES} ${IN_DIR} ${OUT_DIR}
which, with a replfactor of 3, engaged the entire cluster just fine, and ran terasort with no problems
Juju itself seemed to work great in this run, but this brought up a couple of basic optimizations against the EC2 api:
- pass the '-n' options directly to the provisioning agent... don't expand `juju deploy -n <num_units>` and `juju add-unit -n <num_units>` in the client
- pass these along all the way to the ec2 api... don't expand these into multiple api calls
We’ll add those to the list of things to do.
Onward, upward!
To get around the api throttling, we start up batches of 99 slaves at a time with a 2-minute wait between each batch
#!/bin/bash
juju_env=${1:-"-escale"}
juju_root="/home/ubuntu/scale"
juju_repo="$juju_root/charms"
############################################
timestamp() {
date +"%G-%m-%d-%H%M%S"
}
add_more_units() {
local num_units=$1
local service_name=$2
echo "sleeping"
sleep 120
echo "adding another $num_units units at $(timestamp)"
juju add-unit $juju_env -n $num_units $service_name
}
deploy_slaves() {
local cluster_name=$1
local slave_config="$juju_root/etc/hadoop-slave.yaml"
local slave_size="instance-type=m1.medium"
local slaves_at_a_time=99
#local num_slave_batches=10
juju deploy $juju_env --repository $juju_repo --constraints $slave_size --config $slave_config -n $slaves_at_a_time local:hadoop ${cluster_name}-slave
echo "deployed $slaves_at_a_time slaves"
juju add-relation $juju_env ${cluster_name}-master:namenode ${cluster_name}-slave:datanode
juju add-relation $juju_env ${cluster_name}-master:jobtracker ${cluster_name}-slave:tasktracker
for i in {1..9}; do
add_more_units $slaves_at_a_time ${cluster_name}-slave
echo "deployed $slaves_at_a_time slaves at $(timestamp)"
done
}
deploy_cluster() {
local cluster_name=$1
local master_config="$juju_root/etc/hadoop-master.yaml"
local master_size="instance-type=m1.large"
juju deploy $juju_env --repository $juju_repo --constraints $master_size --config $master_config local:hadoop ${cluster_name}-master
deploy_slaves ${cluster_name}
juju expose $juju_env ${cluster_name}-master
}
main() {
echo "deploying stack at $(timestamp)"
juju bootstrap $juju_env --constraints="instance-type=m1.xlarge"
sleep 120
deploy_cluster hadoop
echo "done at $(timestamp)"
}
main $*
exit 0
We experimented with more clever ways of doing the spinup (too little coffee at this point of the night)… but the real fix is to get juju to take advantage of multiplicity in api calls. Until then, timed batches work just fine.
Juju spun the cluster up in about 2 and a half hours. It had about 380TB of HDFS storage
The terasort job that was run from the script above with
SIZE=10000000000
NUM_MAPS=3000
NUM_REDUCES=3000
eventually completed.
After the 1000-node run, we chose to clean up from the previous job and just add more nodes to that same cluster.
Again, to get around the api throttling, we added batches of 99 slaves at a time with a 2-minute wait between each batch until we got near 2000 slaves.
This gave us almost 760TB of HDFS storage
and was running fine
but was stopped early b/c waiting for the job to complete would’ve just been silly at this point. With our naive job config, we’re considerably past the point of diminishing returns for adding nodes to the actual terasort, and we’d captured the profiling info we needed at this point.
Juju spun up 1972 slaves in just over seven hours total. Profiling showed that juju was spending a lot of time serializing stuff into zookeeper nodes using yaml. It looks like python’s yaml implementation is python, and not just wrapping libyaml. We tested a smaller run replacing the internal yaml serialization with json.. Wham! two orders of magnitude faster. No particular surprise.
Ok, so at the end of the day, what did we learn here?
What we did here is the way developing for performance at scale should be done… start with a naive, flexible approach and then spend time and effort obtaining real profiling information. Follow that with optimization decisions that actually make a difference. Otherwise it’s all just a crapshoot based on where developers think the bottlenecks might be.
Things to do to juju as a result of these tests:
So that’s a big enough bite for one round of scale testing.
Next up:
find some better test jobs! benchmarks are boring… perhaps we can use this compute time to mine educational data or cure cancer or something?
perhaps push juju topology information further into zk leaf nodes? Are there transactional features in more recent versions of zk that we can use?
use spot instances on ec2. This is harder because you’ve gotta incorporate price monitoring.
Drop by Charm School:
Details from Jorge’s post:
We're holding a Charm School on IRC.
juju Charm School is a virtual event where a juju expert
is available to answer questions about writing your own
juju charms. The intended audience are people who deploy
software and want to contribute charms to the wider devops
community to make deploying in the public and private
cloud easy.
Attendees are more than welcome to:
Ask questions about juju and charms
Ask for help modifying existing scripts and make charms out of them
Ask for peer review on existing charms you might be working on
Though not required, we recommend that you have juju installed
and configured if you want to get deep into the event.
]]>juju
.
I’ll be updating previous posts to reflect the name changes so they’ll be up to date.
]]>gsettings set org.gnome.settings-daemon.plugins.power lid-close-ac-action 'nothing'
]]>$ aclocal
$ autoconf --force
$ automake --add-missing --copy --force-missing
$ ./configure
$ OS_ARCH=amd64 make
or sometimes you can use
$ autoreconf --force --install
]]>We’ll use juju to deploy a basic node.js app along with a couple of typical surrounding services.. - haproxy to catch inbound web traffic and route it to our node.js app cluster - mongodb for app storage
Along the way, we’ll see what it takes to connect and scale this particular stack of services. I’ll err on the side of too much detail over simplicity in this example, but I’ll try to make it clear when there’s a sidebar topic.
At the end of the day, the deployment for our application would look like the usual juju deployment
$ juju bootstrap
(with a pregnant pause to allow EC2 to catch up)
$ juju deploy --repository ~/charms local:mongodb
$ juju deploy --repository ~/charms local:node-app myapp
$ juju add-relation mongodb myapp
$ juju deploy --repository ~/charms local:haproxy
$ juju add-relation myapp haproxy
$ juju expose haproxy
(with another pregnant pause to allow EC2 to catch up)
We can get the service URLs from
$ juju status
and hit the head of the haproxy service to see the app in action.
We can scale it out with
$ for i in {1..4}; do
$ juju add-unit myapp
$ done
and we’ll soon have a cluster of one haproxy node balancing between five application nodes all talking to a single mongo node in the backend. Of course, we can scale mongo too, but that’s another post.
There are two types of juju charms used in this example:
“Canned Charms”, like the haproxy charm and the mongodb charm, and “Application Charms”, like the node.js app charm.
Canned charms can be used as-is right off the shelf.
Application charms are used to manage your custom application as an juju service. We haven’t nailed down the language on this, but these charms create a contained environment, “framework”, or “wrapper” around your custom application and help it to play nicely with other services.
The node-app charm we use here is meant to be an example that you can fork/adapt and use to maintain custom components of your infrastructure.
node-app
charmThe node-app
charm is the key feature we want to look at.
It’s a charm that will pull your app from revision control
and config/deploy/maintain it as a service within your
infrastructure.
Setup and clone this charm
$ mkdir ~/charms
$ cd ~/charms
~/charms$ git clone http://github.com/charms/node-app
and we’ll walk through it.
README.markdown
config.yaml
copyright
metadata.yaml
revision
hooks/
install
mongodb-relation-changed
mongodb-relation-departed
mongodb-relation-joined
start
stop
website-relation-joined
We can see the usual install
, start
, and stop
hooks for the
node.js service, along with a couple of other hooks for relating to
other services.
Before we go into this in detail, let’s take a little sidebar on the Node.js app we’ll be deploying…
The example app I’m using for this
http://github.com/mmm/testnode
just logs page hits in mongo and reports results.
As usual, I have absolutely no graphic design gifts so things look a little bare-bones. Don’t let that fool you… it’s quite easy to dress this up with some svg maps and some client-side js a la topfunky’s (peepcode.com) node examples.
This is a really basic node app that…
Reads config info
var config = require('./config/config'),
mongo = require('mongodb'),
http = require('http');
from a file config/config.js
module.exports = config = {
"name" : "mynodeapp"
,"listen_port" : 8000
,"mongo_host" : "localhost"
,"mongo_port" : 27017
}
attaches to the mongo instance specified in the config file
var db = new mongo.Db('mynodeapp', new mongo.Server(config.mongo_host, config.mongo_port, {}), {});
spins up a webservice
var server = http.createServer(function (request, response) {
var url = require('url').parse(request.url);
if(url.pathname === '/hits') {
show_log(request, response);
} else {
track_hit(request, response);
}
});
server.listen(config.listen_port);
and handles requests.
The entire app would look something like
//require.paths.unshift(__dirname + '/lib');
//require.paths.unshift(__dirname);
var config = require('./config/config'),
mongo = require('mongodb'),
http = require('http');
var show_log = function(request, response){
var db = new mongo.Db('mynodeapp', new mongo.Server(config.mongo_host, config.mongo_port, {}), {});
db.addListener("error", function(error) { console.log("Error connecting to mongo"); });
db.open(function(err, db){
db.collection('addresses', function(err, collection){
collection.find({}, {limit:10, sort:[['_id','desc']]}, function(err, cursor){
cursor.toArray(function(err, items){
response.writeHead(200, {'Content-Type': 'text/plain'});
for(i=0; i<items.length;i++){
response.write(JSON.stringify(items[i]) + "\n");
}
response.end();
});
});
});
});
}
var track_hit = function(request, response){
var db = new mongo.Db('mynodeapp', new mongo.Server(config.mongo_host, config.mongo_port, {}), {});
db.addListener("error", function(error) { console.log("Error connecting to mongo"); });
db.open(function(err, db){
db.collection('addresses', function(err, collection){
var address = request.headers['x-forwarded-for'] || request.connection.remoteAddress;
hit_record = { 'client': address,'ts': new Date() };
collection.insert( hit_record, {safe:true}, function(err){
if(err) {
console.log(err.stack);
}
response.writeHead(200, {'Content-Type': 'text/plain'});
response.write(JSON.stringify(hit_record));
response.end("Tracked hit from " + address + "\n");
});
});
});
}
var server = http.createServer(function (request, response) {
var url = require('url').parse(request.url);
if(url.pathname === '/hits') {
show_log(request, response);
} else {
track_hit(request, response);
}
});
server.listen(config.listen_port);
console.log("Server running at http://0.0.0.0:" + config.listen_port + "/");
We won’t get into my node.js skillz at the moment… it’s a deployment example.
I’ve also got a package.json
in there to let npm
resolve
some example dependencies upon install.
Now, there’s no standard way to handle configuration in node apps, so it’s quite likely your app’s config looks a bit different. No problem, it’s pretty straightforward to adapt this example charm to handle the way your app works… and use your own config file paths, and config parameter names.
End-of-sidebar… Back to the node-app
charm.
Let’s go through the hooks as they would be executing during deployment and service relation.
The install
hook is kicked off upon deployment,
reads its config from config.yaml
and then will
node
/npm
app_repo
npm
if your app contains package.json
config/config.js
mongodb
servicestart
and stop
are trivial in this charm because
we want to wait for mongo to join before we actually run
the app. If your app was simpler and didn’t depend on
a backing store, then you could use these hooks to
manage the service created during installation.
The key to almost every charm is in the relation hooks.
This particular app is written against mongodb so the app’s charm has hooks that get fired when the “app” service is related to the mongo service.
This relation was defined when we did
$ juju add-relation mongodb myapp
and the relation-joined/changed
hooks
get fired after the install
and start
hooks have successfully completed for both
ends of the relationship.
The mongodb-relation-changed
hook in this charm
will read config from config.yaml
install
That’s it really… our app is up and running at this point.
Note that the example here depends on mongo,
but juju makes it easy to relate to some other backend db.
Just like we have mongodb-relation-changed
hooks, we
could just as easily have cassandra-relation-changed
hooks
that would look strikingly similar. Of course, our app would
have to be written in such a way that it could use either,
but that’s another topic. The deployment tool supports
the choice being made dynamically when relations are joined.
I’d say “at deployment time” but it’s even better than that
because I can remove relations and add other ones at
any time throughout the lifetime of the service… and the
correct hooks get called.
For this example, I’d like to use haproxy to load balance
This example stack uses haproxy to handle initial web requests from outside. haproxy will load balance across multiple instances of our app. That way we could just attach an elastic ip to haproxy, configure dns, and we’re cruising (of course we’re leaving out plenty of infrastructure aspects like monitoring/logging/backups/etc that are pretty important for a production deployment in the cloud).
The app charm has hooks that get fired when the “app” service is related to the haproxy service. Just as above, this relation was defined when we did
$ juju add-relation haproxy myapp
and the relation-joined/changed
hooks
get fired after the install
and start
hooks have successfully completed for both
ends of the relationship.
The website-relation-changed
hook in this charm
in its entirety:
#!/bin/sh
app_port=`config-get app_port`
relation-set port=$app_port hostname=`hostname -f`
simply tells the haproxy service which address and port our application uses to handle requests.
We could of course configure our app to listen on port 80, tell the charm to open port 80 in its firewall, and then expose port 80 for our app service to the outside world. That’d be fine if we never needed to scale or we were planning to load balance multiple units of our app using dns, elastic load balancer instances, or something else external.
Again, note that the example here uses haproxy, but
we could easily swap that out with any other service
that consumed the juju http
interface.
Ok, so I lied a little up above when I said that the hooks
read config info from config.yaml
. Yes, they do read config
information from there, but that’s not the whole story.
The values of the configurable parameters can be set/overidden
in a number of different ways throughout the lifecycle of
the service.
You can pass in dynamic configuration during deployment or later at runtime using the cli
`juju set <service_name> <config_param>=<value>`
or configure the charm at deployment time via a yaml
file
passed to the juju deploy --config
command.
Scaling with juju works really well. The key to this lies in the boundaries between configuration for the service itself, versus configuration for the service in the context of a relation with another service.
When these two types of configuration are well isolated, scaling with juju just works. I’ve caught myself several times working on just getting a service charm working, with no real thought to scalability, and being pleasantly surprised to find out that the service pretty much scales as written.
The best way to grok this is to walk through the process of joining your relations as single unit services…
In our example,
haproxy <-> myapp <-> mongodb
containers for each service get instantiated, then the install
and start
hooks are run for each service. Once both sides
of relations are started
then the relation hooks get called:
joined
and then usually several rounds of changed
depending
on the relation parameters being set. Once these are complete,
the services are up, related, and running.
Ok, now comes scaling. juju add-unit myapp
adds a new
myapp
service node and goes through the whole cycle above.
The “services” are already related, so the relation hooks are
automatically fired as each new unit is started
.
Since we divided up
the installation/configuration/setup/startup of the service
into the parts that are specific to the service and parts that
are specific to the relation with another service, then each
new unit runs “just enough” configuration to join it to the
cluster.
Not all tools can be configured like that, but that’s the key to strive for when writing relation hooks. Identify the components of your application configuration that really depend on another service, and isolate them as much as possible. Only configure relation-specific things in the relation hooks. The more minimal the relation hooks, the more scalable the service.
]]>Updated on 2011-11-08: The ubuntu project “ensemble” is now known as “juju”. This post has been updated to reflect the new names and updates to the api.
Deploy hadoop and ganglia using juju:
$ juju bootstrap
$ juju deploy --repository "~/charms" local:hadoop-master namenode
$ juju deploy --repository "~/charms" local:ganglia jobmonitor
$ juju deploy --repository "~/charms" local:hadoop-slave datacluster
$ juju add-relation namenode datacluster
$ juju add-relation jobmonitor datacluster
$ for i in {1..6}; do
$ juju add-unit datacluster
$ done
$ juju expose jobmonitor
When all is said and done (and EC2 has caught up), run the jobs
$ juju ssh namenode/0
ubuntu$ sudo -su hdfs
hdfs$ hadoop jar hadoop-*-examples.jar teragen -Dmapred.map.tasks=100 -Dmapred.reduce.tasks=100 100000000 in_dir
hdfs$ hadoop jar hadoop-*-examples.jar terasort -Dmapred.map.tasks=100 -Dmapred.reduce.tasks=100 in_dir out_dir
While these are running, we can run
$ juju status
to get the URL for the jobmonitor ganglia web frontend
http://<jobmonitor-instance-ec2-url>/ganglia/
and see…
and a little later as the jobs run…
Of course, I’m just playing around with ganglia at the moment… For real performance, I’d change my juju config file to choose larger (and ephemeral) EC2 instances instead of the defaults.
Let’s grab the charms necessary to reproduce this.
First, let’s install juju and set up a our charms.
$ sudo apt-get install juju charm-tools
Note that I’m describing all this using an Ubuntu laptop to run the juju cli because that’s how I roll, but you can certainly use a Mac to drive your Ubuntu services in the cloud. The juju CLI is already available in ports, but I’m not sure the version. Homebrew packages are in the works. Windows should work too, but I don’t have a clue.
$ mkdir -p ~/charms/oneiric
$ cd ~/charms/oneiric
$ charm get hadoop-master
$ charm get hadoop-slave
$ charm get ganglia
That’s about all that’s really necessary to get you up and benchmarking/monitoring.
I’ll do another post on how to adapt your own charms to use monitoring
and the monitor
juju interface as part of the “Core Infrastructure”
series I’m writing for charm developers. I’ll go over the process of
what I had to do to get the hadoop-slave
service talking to monitoring
services like ganglia
.
Until then, clone/test/enjoy… or better yet, fork/adapt/use!
]]>